(2023)
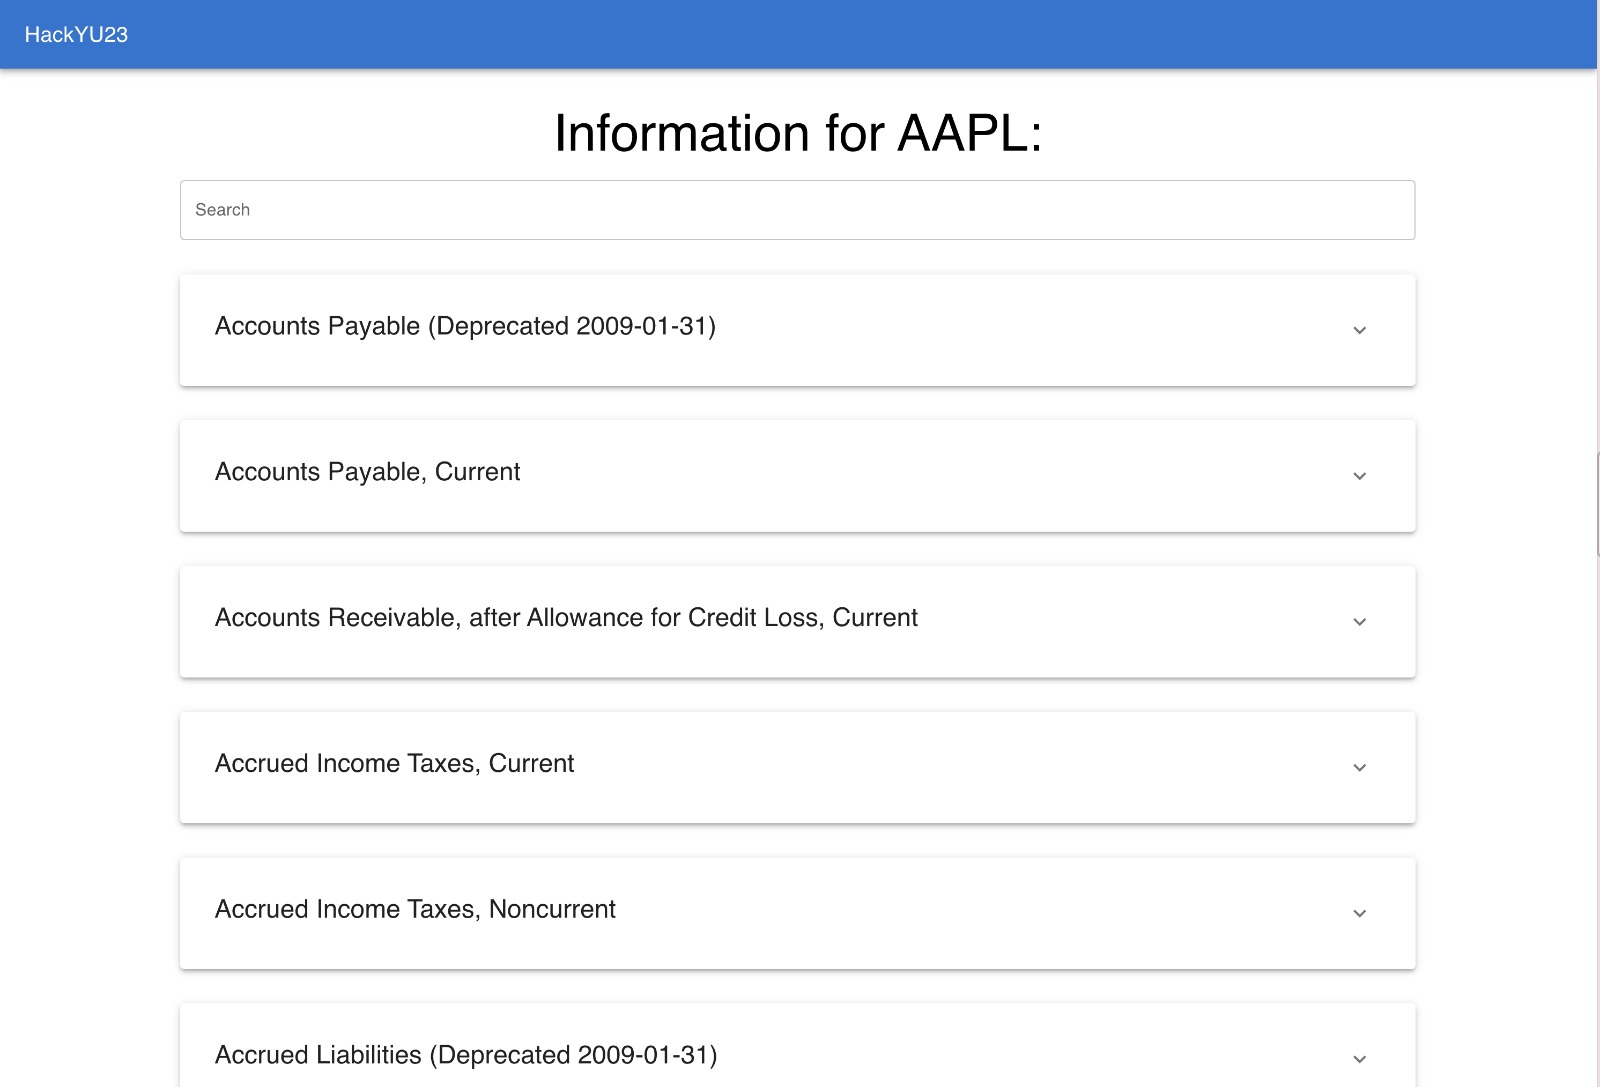
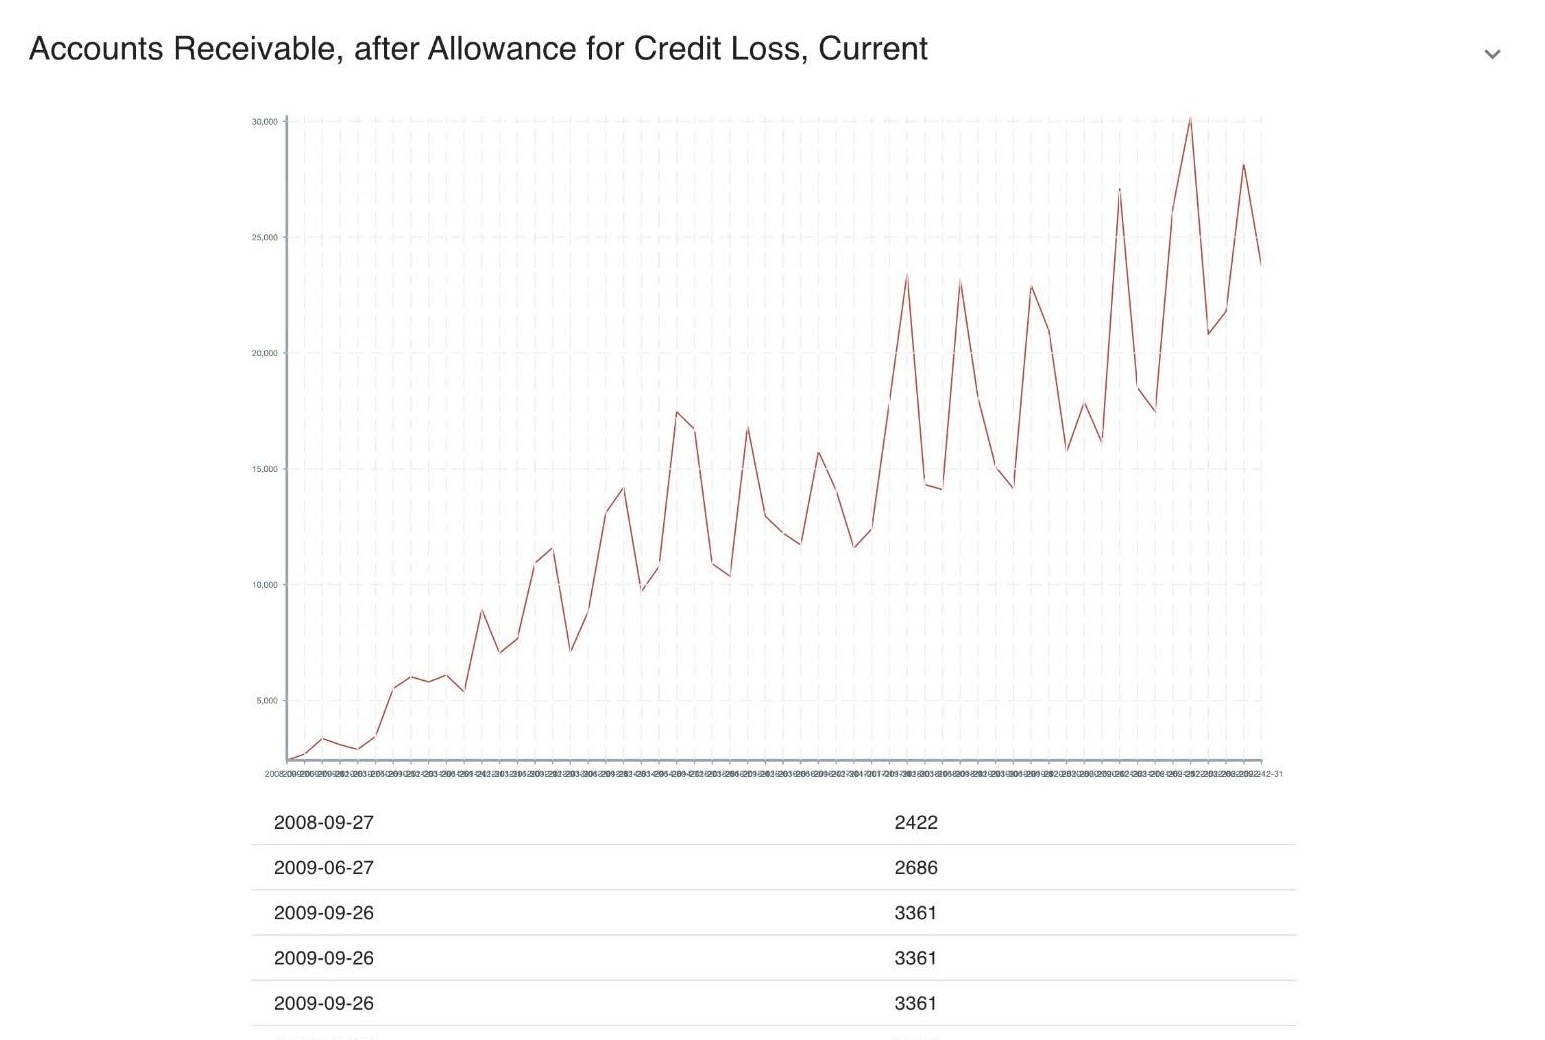
This project won the first prize in our university hackathon! Essentially, it was a tool that provided data visualizations of stocks. The project showed important metrics including unusual moves taken from 10-Q financial statements for the individual stock ticker. Instead of combing through 100’s of SEC documents, users could instantly see outliers and trends in SEC filings.
- Tech Stack: Python (for data analysis) and React.js (for data visualization).

